Proppy HF Circuit Prediction: SSN Data
Sun Spot Number (SSN)
Determination of ionospheric characteristics related to HF propagation requires knowledge of the prevailing levels of solar activity (ITU-R P.1239-3, 2012). The Sunspot Number (SSN), quantifying of the number of dark spots visible on the Sun’s surface, has historically served as the primary proxy of solar activity (Clette et al., 2015). Records of SSNs date back over 400 years, providing a valuable insight into the sun's quasi periodic 11-year cycle of activity. Superimposed onto this cycle are shorter term variations that can result in large fluctuations in day-to-day values.
The figure below illustrates how daily values (yellow) may be averaged over month (blue) and monthly smoothed (12-month) (red) periods, eliminating complex short term variations to yield a more predictable indicator of solar activity. The preferred ionospheric metric when determining the critical frequencies of the various layers and the MUF factor M(3000)F2 is a 12-month running mean sunspot number, R12 (ITU-R P.1239-3, 2012). R12 values are a function of sunspot values extending at least six months either side of the month of interest (ITU-R P.371-8, 1999). (Note that this has the unfortunate side effect that an R12 value for a given month ‘m’ cannot be absolutely determined until ‘m+6’ (six months later)).
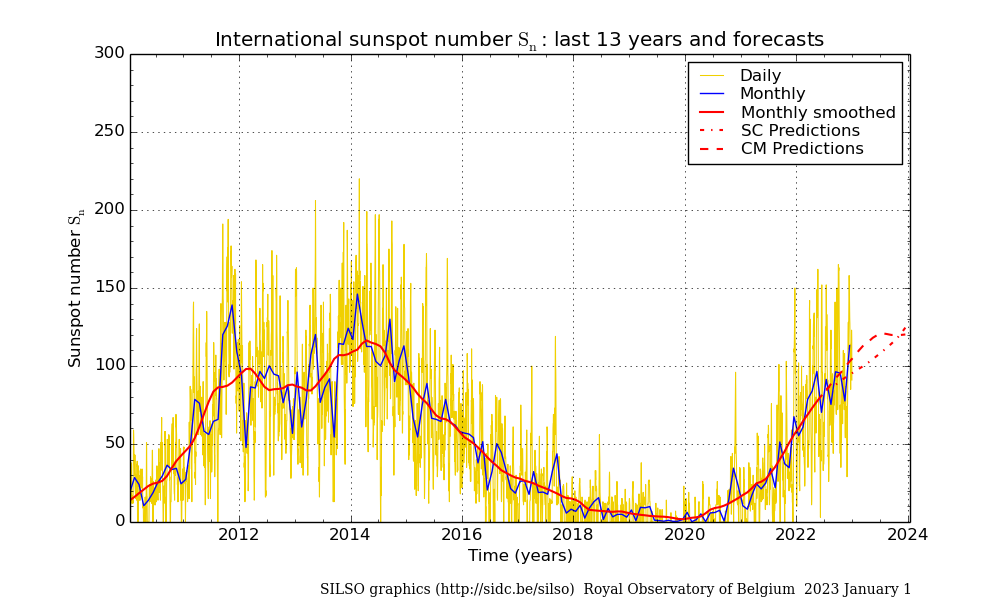
Image Source: WDC-SILSO, Royal Observatory of Belgium, Brussels
SSN Values
Recommendation ITU-R P.371-8 (1999) states that the SSN (R12) values presented in the ITU's Circular of Basic Indices for Ionospheric Propagation should be used in conjunction with Recommendation ITU-R P.533-14, which defines ITURHFProp's underlying algorithm. Values presented in the circular are derived from the SSN (Standard Curves method) data published by WDC-SILSO, Royal Observatory of Belgium, Brussels. In addition to the Standard Curves (SC) dataset, the SIDC also publish predictions based on the Combined Model (CM) and the McNish & Lincoln (M&L) method.
- Standard Curves
- Based on the sunspot number with and uses mean-cycle curves derived from historical data to produce predictions. The Standard curves are considered to be effective at predicting the declining phase of a cycle but breaks down when approaching the minima so is not so reliable at predicting the rise of the successive cycle.
- Combined Method
-
The combined method makes predictions based on the sunspot number, comparing all cycles recorded since 1749, combined with an assessment using the the geomagnetic index (aa). The geomagnetic index, 'aa', is an indicator of the level of future solar activity. For this reason, the Combined Model may produce superior results when passing the Solar minimum.
- McNish & Lincoln
-
The McNish & Lincoln method is the most established of the three models, dating back to 1949, and is of interest for largely historical reasons. As with the Standard Curves method, only the sunspot is considered as an input which in this case is compared to historical data for the period 1849 to 1975 (cycles 9 to 20). This provides fair predictive abilities for much of the cycle but, in common with the Standard Curves method, is less effective at the minima (±1.5 year).
Podladchikova and Van der Linden (2012) demonstrate how the accuracy of predictions may be improved by the application of a Kalman filter, yielding a total of six sets of predicted SSN data.
The above suggests that while the Standard Curves model provides a reliable source of data for much of the solar cycle, users may wish to experiment with other models, particularly the Combined Model at cycle's minima. Proppy supports selection from all six of the datasets provided by the SIDC.
The (predicted) R12 values for April 2024 are;
| Model | Standard | Kalman Filter |
|---|---|---|
| Standard Curves | 123.7 | 123.0 |
| Combined Model | 122.4 | 117.0 |
| McNish & Lincoln | 128.4 | 121.0 |
It should be noted that selection of the SSN Source parameter only has an effect on predicted values, i.e. values extending from six months ago.
Data Source: WDC-SILSO, Royal Observatory of Belgium, Brussels
Data Source: WDC-SILSO, Royal Observatory of Belgium, Brussels
Daily Values
While smoothed values are required to calculate critical frequencies of the various layers and the MUF factor, it is useful to remember that the actual value on any given day will almost certainly be different to the smoothed monthly value. Figure 3 below indicates the current daily Estimated International Sunspot Number (EISN) obtained by a simple average over available sunspot counts. This data is not intended for long term use but may provide some insight into the stability of solar conditions.
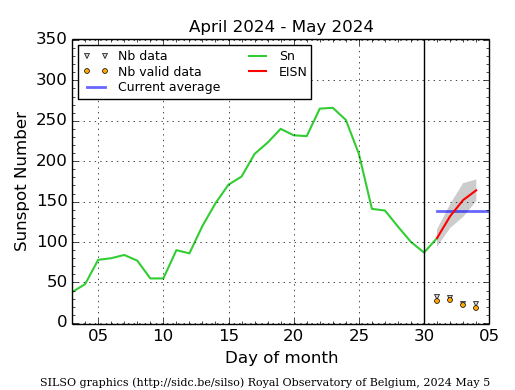
Image Source: WDC-SILSO, Royal Observatory of Belgium, Brussels
References
- Clette, F., Svalgaard, L., Vaquero, J.M. and Cliver, E.W., (2015), Revisiting the sunspot number, The Solar Activity Cycle (pp. 35-103). Springer New York. Available from: http://arxiv.org/pdf/1407.3231
- ITU, Circular of Basic Indices for Ionospheric Propagation, Latest
- ITU-R P.371-8 (1999), Choice of Indices for Long-Term Ionospheric Predictions, Recommendation ITU-R P.371-8
- ITU-R P.1239-3(2012), ITU-R Reference Ionospheric Characteristics, Recommendation ITU-R P.1239-3
- Podladchikova, T. and Van der Linden, R.(2012), A Kalman Filter Technique for Improving Medium-Term Predictions of the Sunspot Number Available from: Researchgate Accesed 30th October 2017.